Pivot Point Reversals Strategy for Futures Trading
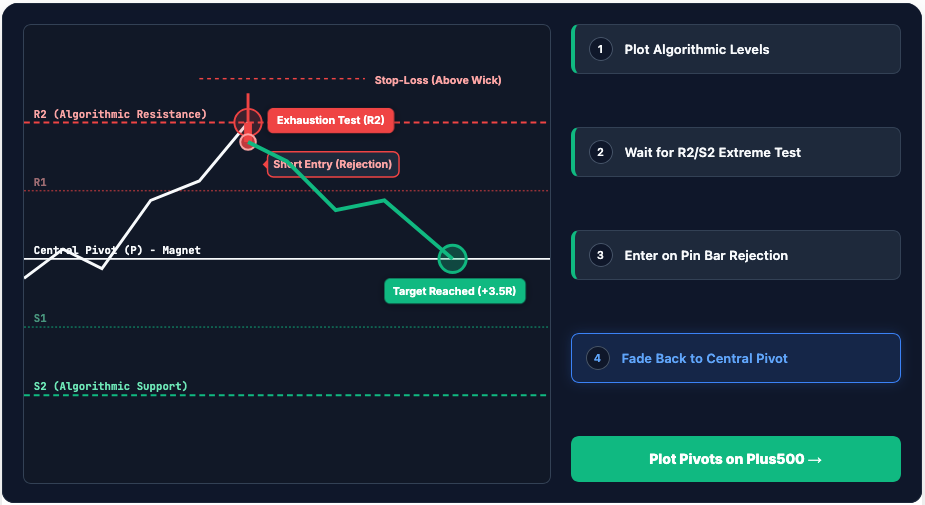
Unlike Moving Averages or RSI which lag behind the price, Pivot Points are a leading indicator. Before the market even opens, the Pivot levels for the day are already calculated and drawn on your chart based purely on the High, Low, and Close of the previous trading day. Because they are static mathematical equations (Standard, Woodie, or Camarilla), millions of algorithms and floor traders are looking at the exact same lines. The Central Pivot (P) acts as the day’s center of gravity. The Support lines (S1, S2, S3) and Resistance lines (R1, R2, R3) act as massive institutional barriers where limit orders are heavily stacked.