Stop chasing green candles and getting stopped out. Learn how institutional algorithms use mathematical Fibonacci sequences to scale into established trends at a massive discount.
Core Concept: Buying deep, systematic pullbacks in an established uptrend.
Top Markets: MES (S&P 500), MGC (Gold), 6E (Euro FX)
Key Triggers: Price rejects perfectly off the 61.8% (Golden Ratio) or 50% level.
Stop-Loss Placement: Just below the 78.6% level or the original Swing Low.
Profit Target: The 0% level (Previous High) and the -27.2% Extension.
Recommended Account: Free Unlimited Demo or $10 Micro Live
1. The Math Behind the Market Moves
Markets never move in straight lines. They breathe. They push forward (impulse), and they pull back (retracement) to gather liquidity before the next push. But how deep will the pullback go?
Institutional trading algorithms are programmed heavily using the Fibonacci Sequence, a mathematical ratio found throughout nature and finance. The most critical level is the 61.8% (The Golden Ratio). When a market is in a healthy trend, it will frequently retrace exactly 50% to 61.8% of its previous impulse wave before institutional buyers step back in to defend their trend.
We call this the “Golden Zone”. By waiting for price to enter this zone, you buy assets at a massive discount with a clearly defined, tight risk profile.
2. Anatomy of the Fibonacci Trade
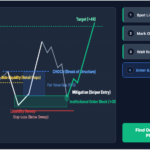
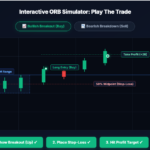
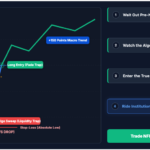
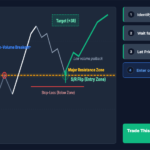
The beauty of this strategy is its geometric precision. You map out the battlefield before the price even gets there.
3. Step-by-Step Mechanical Execution
Remove the guesswork from your entries. Follow these 4 exact steps to trade the Fibonacci Golden Zone:
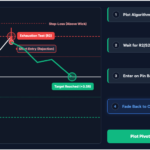
Identify the Impulse Wave (A to B): Wait for a strong, clear, directional move. Identify the absolute lowest point (Swing Low) and the absolute highest point (Swing High) of the move.
Draw the Fibonacci Tool: Drag your Fibonacci Retracement tool from the Swing Low (100%) to the Swing High (0%). Your charting software will automatically plot the 38.2%, 50%, and 61.8% levels.
Wait for the Golden Zone: Do not buy the shallow 38.2% pullback. Let the weak hands get shaken out. Wait patiently for the price to bleed down into the 50% – 61.8% pocket.
Enter on Rejection: When price touches the 61.8% line, look for a bullish rejection candle (a long wick or a bullish engulfing body). Execute your Buy order. Target the -27.2% Fibonacci extension for a massive 1:3+ Risk/Reward trade.
Map the Golden Zone on Live Charts
Practice drawing Fibonacci retracements on real-time CME data with professional, zero-fee charting tools.
A Fibonacci level is not a magical trampoline. It only works if the broader market context aligns. Use these three filters:
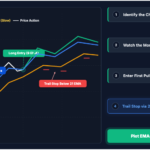
The EMA Confluence: The best Fibonacci trades happen when the 61.8% level lines up exactly with a major moving average (like the 21 EMA or 50 SMA). This “double support” acts as concrete for institutions.
The ABC Correction Pattern: The pullback into the Golden Zone should not be a violent, straight line down. It should ideally form a slow, 3-wave “ABC” zigzag correction, showing exhaustion among sellers.
Beware the 78.6% Level: If price breaks and closes strongly below the 61.8% level, the trend is severely damaged. While some traders buy the 78.6% level, professionals usually abort the trade, as the probability of a full trend reversal is too high.
Ready to Trade the Deep Pullbacks?
Stop chasing highs. Buy the institutional dips with a $10 minimum deposit and direct access to US Futures markets.