Stop guessing where the market will reverse. Learn how professional CME day traders use horizontal Volume Profile to pinpoint the exact price levels where institutional algorithms hide their largest limit orders.
Difficulty: Advanced Optimal Timeframe: 15-Min & 1-Hour Best Window: 10:00 AM – 3:00 PM EST
⚡ Strategy Blueprint at a Glance
Core Concept: Price Rejection at the Highest Traded Volume Node (POC)
Top Markets: MES (S&P 500), MNQ (Nasdaq), MGC (Gold)
Key Indicator: Session or Visible Range Volume Profile
Stop-Loss Placement: Outside the Value Area (VAH/VAL)
Profit Target: Next Low Volume Node (LVN) or 1:3 Risk/Reward
Recommended Account: Free Unlimited Demo or $10 Micro Live
1. What Is the Volume Profile and POC?
Traditional volume bars at the bottom of your chart show you when trading activity happened. Volume Profile (and Market Profile) turns this sideways, showing you exactly at what price the heaviest trading occurred.
In the futures market, institutions build massive positions over time. The specific price level where the most volume changed hands during a session is called the Point of Control (POC). The surrounding price range that contains 70% of the day’s total volume is known as the Value Area.
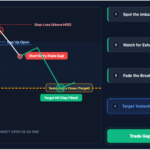
When the price leaves the Value Area and later returns to “retest” an untested (naked) POC, institutional algorithms aggressively step in to defend their original positions. This creates one of the highest-probability bounce setups in day trading.
2. Anatomy of the POC Bounce Trade
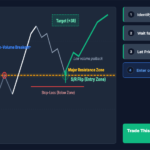
Unlike breakout strategies that require momentum, the POC strategy is a reversion to the mean approach. You are waiting for the price to come to you, allowing for incredibly tight stop-losses and massive risk-to-reward ratios.
3. Step-by-Step Mechanical Trading Rules
Trading the Volume Profile requires immense patience. You are acting as a sniper. Follow this exact 4-step checklist:
Map Your Levels (Pre-Market): Before the 9:30 AM EST bell, draw horizontal lines at yesterday’s POC, VAH, and VAL. These are your battlegrounds for the day.
Wait for the Retest: Ignore the chaotic opening hour. Let the market establish its direction and wait for an exhaustion move back toward your plotted POC level.
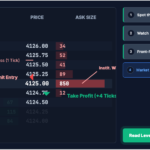
Confirm with Price Action: Never place blind limit orders. Watch the DOM (Depth of Market) or wait for a strong 5-minute rejection pin-bar precisely at the POC line before pulling the trigger.
Execute and Manage: Once filled, set your stop immediately outside the Value Area. When the trade moves +1.5R in your favor, trail the stop to breakeven to secure a risk-free position.
Want to test institutional Volume Profile tools?
Practice finding the Point of Control on live CME data charts with zero software fees.
To avoid catching a falling knife when the market crashes through a volume node, professionals use these three strict filters:
The “Virgin POC” Rule: Only trade the first time price returns to the POC. If the level has already been tested and bounced earlier in the week, its institutional liquidity is depleted. Ignore it.
Avoid the High-Volume Churn: Never initiate a breakout trade directly inside the Value Area. Price action inside the Value Area is choppy and unpredictable. Only take trades on the edges (VAH/VAL) or at the exact POC.
News Event Blackouts: Never trade a POC bounce during Federal Reserve announcements or CPI data releases. Macroeconomic news completely overrides historical volume structure.
Ready to Trade the Institutional Levels?
Start mapping the Point of Control with a $10 minimum deposit, $0 platform licensing fees, and instant access to the CME.